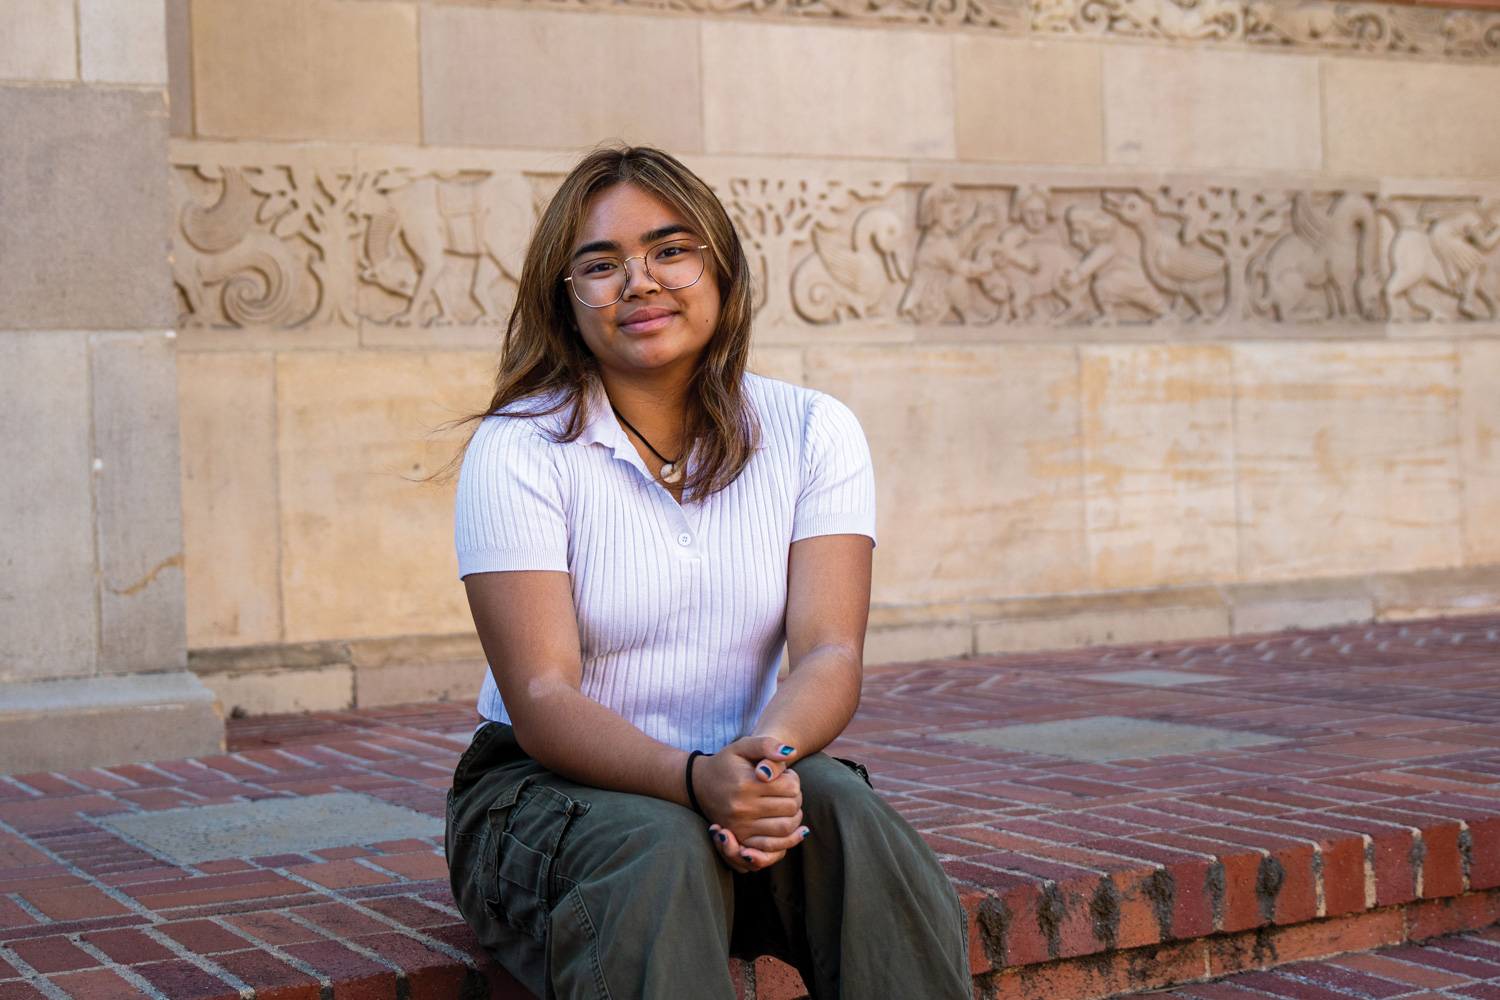
Making Data More Used and Useful Undergraduate courses meet growing desire of students like Arielle Cunanan to master new technologies
By Mary Braswell
Each year, the Los Angeles Unified School District surveys its students, parents, teachers and staff, collecting hundreds of thousands of responses to questions about academics, safety, campus climate, emotional maturity and more.
A group of UCLA Luskin students got the unique opportunity to take a deep dive into this massive pool of raw data, identifying trends and developing insights to help principals better understand their schools’ strengths and areas for improvement.
The undergraduates and a select group of master’s students were enrolled in “Data Analysis for Educational Equity and Improvement,” offered for the first time in spring 2023. It’s one of a number of new offerings added to the Public Affairs curriculum to meet a growing demand for data and technology courses in the social sciences.
“Our students care about the world and want to make a difference. And one of the ways we learn about the world is exploring data sets,” said Meredith Phillips, the associate professor of public policy who developed the course with funding from the UCLA Chancellor’s Award for Community-Engaged Research.
“It’s a way of introducing students to the joy of becoming a scholar and a discoverer. And that’s what’s awesome about a research university, right? We essentially spend much of our time learning new things.”
The class was an upper division offering, but every Public Affairs major must complete basic coursework in the tools of quantitative analysis. Some love it; others do not.
But undergrads who get a taste of multivariate regression and chi-squared tests and simply want more now have additional courses to choose from, including open spots in graduate-level classes offered by the Luskin School’s Public Policy and Urban Planning programs. Many go on to learn a new type of foreign language, including R, Python and SQL.
“We’re getting a lot of students who are interested in the intersection of data science, tech and public affairs,” said Erika Villanueva, director of student services for the undergraduate program.
“We’re always thinking about what else we can do with our curriculum to support our students and to augment what we already offer. So, it just became a natural progression to add to our research methods offerings.”
Undergrad Arielle Cunanan said her first encounter with statistical analysis came through Public Affairs 60, “Using Data to Learn About Society,” a core course taught by Phillips.
“I never touched coding, never touched data science or analytics or computer science — nothing before 60,” she said. “And Professor Phillips was amazing. She really cared about teaching us about statistics and data analysis specifically for public affairs and social justice issues.”
When Cunanan spotted Phillips’ new course on educational equity, she jumped at the chance to enroll.
Working on behalf of a local elementary school, she and her team sharpened their proficiency in R, the programming language used to clean, organize and analyze the trove of survey data from LAUSD.
“It was hard. It was stressful. There were late nights. But then we got into the groove,” said Cunanan, who is majoring in psychology with a public affairs minor.
As patterns began to emerge from the enormous pool of data, the students set out to share their findings. That led to another key skill the course emphasized: In addition to being scientifically sound, the discoveries drawn from data must also be clearly and powerfully communicated.
Cunanan said her team was grateful for the opportunity to deliver two presentations to the school’s leadership team.
“The first time around, it was a bunch of charts, a bunch of graphs, different bar plots about each variable. It was just throwing numbers at them, statistics, percentages,” she said.
“And so, the next time around, we put ourselves in their shoes and said, OK, if we’re the administration, what do we need to see to help us create change at our school based on these variables? How can we make this more understandable so that it’s actually helpful?”
The team distilled the most relevant findings and conveyed them in a simpler presentation with bullet points, a few targeted graphs and time for fielding questions.
The experience has turned Cunanan into a true believer in the power of data to compel social change. She says she is bent on learning every coding language she can during her time at UCLA.
“Once you feel like you sort of get it, it really teaches you how to do hard things,” she said. “For me, if I could do this, I could do anything.”
“Data Analysis for Educational Equity and Improvement” arose out of Phillips’ desire to teach students how to find data-informed solutions to the pressing needs of local schools.
It’s the type of work she has conducted for more than a decade as co-founder of the Los Angeles Education Research Institute at UCLA Luskin, a role that has put her in close collaboration with LAUSD decision-makers. The annual School Experience Survey has been a crucial resource in Phillips’ research.
“We had heard a lot of folks at the district saying we wish these survey data were more used and useful,” she said. “So I thought that there might be a really neat opportunity to help train students in data analysis and data communication, then use them as analysts for particular schools and principals.
“They use real data with a real audience, an audience that genuinely cares.”
Winning the Chancellor’s Award for Community-Engaged Research allowed Phillips to hire a team of undergraduates to help her develop and test the curriculum.
“The class is a really hands-on, applied class. It develops problem-solving skills and logic skills and communication skills,” she said.
“The students learn that data has many kinds of roles to play. It’s useful for telling stories, making arguments and for trying to understand the world — and for making the world better in education.”


Leave a Reply
Want to join the discussion?Feel free to contribute!