
Participation in 2020 U.S. Census Is Falling Behind UCLA analysis shows the current rate of response is at least 11 percentage points lower than in 2010
By Les Dunseith
The national response rate to the U.S. Census is lagging well behind where it was at a similar point a decade ago, according to an analysis spearheaded by Paul Ong, a research professor and director of the UCLA Center for Neighborhood Knowledge.
Ong said shutdown orders related to the novel coronavirus pandemic seem to be a factor in suppressing the response rate, which is now at least 11 percentage points lower than it was for the 2010 census through late April.
The UCLA researchers noted that the self-response phase of the current census began March 12, which happened to coincide with mandated restrictions on gatherings and physical movements imposed in the state of Washington by Gov. Jay Inslee — some of the earliest such rules in the nation. His order also closed all schools in the three counties most affected by the coronavirus at the time.
Within a week, even more extreme physical distancing measures were in effect in states such as Washington, California and New York — and soon throughout the nation — as public officials ordered businesses to close and citizens to remain at home in an attempt to slow the advance of COVID-19.

Paul Ong is director of the Center for Neighborhood Knowledge at UCLA Luskin. Photo by UCLA Luskin School of Public Affairs
“April 1 was designated as Census Day in an effort to highlight the importance of a complete and accurate count of American citizens,” said Ong, who has served as an adviser to the U.S. Census Bureau as part of his scholarly activities at the UCLA Luskin School of Public Affairs. “But that designation proved to be ceremonial at best, drawing little media notice or public attention with the vast majority of Americans hunkered down at home as a result of the shelter-in-place strategy.”
Ong said his findings are worrisome and seemingly at odds with the positive message coming from the Census Bureau. A bureau email blast sent in late April, for example, declared “an important milestone in the 2020 Census. More than half of all the households in the country have responded — that’s 77,500,000 households so far!”
Ong said crossing the halfway mark in the census count is less impressive when one looks below the surface. He noted, for example, that on April 18, the New York Times reported that the COVID-19 crisis had seriously hampered the response to the census, causing the Census Bureau to adjust its timeline and prolong the collection process to counter any shortfalls. The agency had earlier extended deadlines to complete its operations.
“The adjustments are framed and justified as necessary to protect the health of census workers and the public, which is obviously valid and prudent,” Ong said. “But nothing was mentioned about the need to extend census operations because of any possible lack of progress.”
The 2020 census is the first to allow people to respond online, by phone or by mail, while the 2010 census was limited to mail responses only.
In its analysis, the Center for Neighborhood Knowledge compared the overall response rate so far to the mail-in rate at the same point for the 2010 census. The researchers looked at both the 2010 mail-response rate — the total number of filled-in and returned forms divided by the total number of addresses in the government’s master address file — and the mail-return rate, the number of returned forms divided only by the number deliverable and non-vacant addresses.
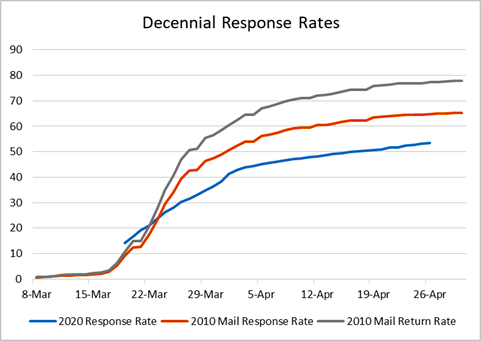
When the three measures are plotted on a graph, it is apparent that a slowdown in 2020 census responses coincides with the timing of the COVID-19 crisis. By March 22, the 2020 rate had slipped below the rate of return for both of the 2010 measures and has continued to lag since then. Since April 24, the date of the email blast from the Census Bureau, the 2020 response rate has never gotten closer than 11 percentage points below both of the 2010 measures, the UCLA analysis shows.
The researchers note that because the 2010 mail-return rate has a smaller denominator, it has a higher value than the 2010 mail-response rate. According to the Census Bureau, the 2010 mail-response is more compatible with how the 2020 response rate is being calculated.
Besides the COVID-19 pandemic, other factors may be hindering 2020 responses, Ong said. Those barriers may include a lack of access to the internet, which is the primary mode of data collection for the 2020 census; a nationwide increase in vacant and seasonal housing; and the growth of the historically harder-to-reach Hispanic population.
The decennial census is required so that congressional seats can be reapportioned to account for geographic shifts in the population. The official count is also used for redrawing electoral district boundaries for congressional, state legislative and local jurisdictions. Equally important, the numbers are used in allocating public funds and helping to provide a clearer picture of the nation’s population and housing stock.
Unless steps are taken immediately to boost response rates, Ong is worried that the 2020 census is experiencing “a real and present danger of having one of the most incomplete census enumerations in history.”
Based on historical precedent, the Center for Neighborhood Knowledge analysis predicts that an undercount would disproportionately affect low-income residents, people of color and immigrants.
“The Census Bureau is not to be blamed for the dire circumstances that have upended everyone’s life,” Ong said. “What is required now, however, is mobilizing community organizations and groups to work collaboratively with public agencies to minimize the damage. We need to focus scarce resources to do everything in our power to ensure inclusion in the census of society’s most marginalized people and neighborhoods.”
Questions about the study may be directed to Paul Ong at pmong@ucla.edu
To inquire about the proprietary data used to build the chart, contact Les Dunseith at the UCLA Luskin School of Public Affairs, ldunseith@luskin.ucla.edu


Leave a Reply
Want to join the discussion?Feel free to contribute!