A new grant of $500,000 from Wells Fargo will support efforts by researchers affiliated with the Luskin School to determine best practices and policy solutions to benefit businesses operated by persons of color.
“COVID-19’s disparate impact on small business owners of color highlighted the enduring legacy of structural barriers that impede economic opportunity and social mobility for large swaths of working Americans,” said Maria Samaniego, deputy director of UCLA LPPI. “This grant will allow us to develop policy research and resources that are specifically tailored to the needs of communities of color, which have the power to transform small business ownership in ways that will drive our economy for generations.”
UCLA LPPI and CNK will focus on understanding how to broaden access to financial services and technology tools. They will also explore how to best leverage public, private and social partnerships to boost the entrepreneurship potential of small businesses owned by Latinos and other people of color. The findings will lead to more informed decisions about post-COVID economic recovery policy relating to minority-owned businesses. Another goal will be increasing labor force participation in those communities.
“We cannot ignore the bright spotlight the pandemic has put on inequity, nor the responsibility and opportunity we have to close gaps in resources that have existed for far too long,” said Jenny Flores, head of small business growth philanthropy at Wells Fargo. “Investing in UCLA LPPI and CNK will offer an in-depth view into how the public and private sectors can better support and accelerate access for business owners of color who will be at the forefront of building an inclusive economy.”
Research Professor Paul Ong, director of CNK, pointed to previous research from UCLA that has identified economic and social impacts of the COVID-19 pandemic and produced insight into how society’s systems and institutions often work against the interests of people in disadvantaged communities. “With this funding, we will be able to pinpoint the exact systemic barriers and to generate the knowledge to remove them for future generations,” he said. “Equally important, new insights will inform new practices that create greater equity for people of color.”
Support from Wells Fargo will also enable UCLA LPPI and CNK to identify best practices in sustainability that small businesses can adopt to help them meet the challenges presented by climate change.
A newly released reportfrom the UCLA Luskin Institute on Inequality and Democracy examines coroner’s data to provide a detailed profile of people in Los Angeles County who may have been unhoused when they died during the worst months of the COVID-19 pandemic.
The report looks at publicly available data from the Los Angeles County Examiner-Coroner’s website and filters it based on locations of death closely affiliated with unhoused status. Researchers identified 1,493 persons who may have been unhoused when they passed away on Los Angeles County’s streets or in outdoor spaces between March 2020 and July 2021.
Researchers looked separately at the 418 deaths that occurred in L.A. County hotel or motel rooms during the same time period. The report argues that these deaths should also be examined because such locations served as a primary site of residency for the unhoused amid the pandemic as part of the state’s COVID-19 response targeting the homeless population, known as Project Roomkey, or because these persons were likely experiencing dire housing precarity and relied on hotel and motel rooms as housing of last resort.
Nearly half of those who died in hotel/motel locations were white and almost 30% were women. Roughly 3 in 5 of the deaths were attributed by the coroner to drug or alcohol overdose.
At a time when public concern about overdoses is growing, the report calls for a deeper understanding, viewing such deaths “not as individual acts of overdose but rather as a collective condition of suffering caused by displacement.” The report also includes profiles of two unhoused community members who died during this time, Tony Goodwin and Salvy Chic.
Institute Director Ananya Roy, professor of urban planning, social welfare and geography, wrote in the report: “We have felt the imperative to present this analysis of coroner’s data because it provides an understanding of key patterns and trends that are of direct relevance to the struggle for justice and freedom in Los Angeles.”
Other key findings include:
Over 35% of the deaths were at locations designated as sidewalks.
The average age at the time of death was 47.
The coroner attributed nearly half to an accidental manner of death, with less than one-fifth attributed to natural causes. Among the accidental deaths, almost 40% were attributed by the coroner to drug or alcohol overdose.
Chloe Rosenstock, a UCLA undergraduate student and Street Watch LA organizer, was a co-author of the report, which is titled, “We Do Not Forget: Stolen Lives of L.A.’s Unhoused Residents During the COVID-19 Pandemic.” It was prepared in cooperation with the After Echo Park Lake research collective led by Roy, with guidance from Unhoused Tenants Against Carceral Housing(UTACH) and organizers in Street Watch LA and Ground Game LA.
Since Oct. 1, customers who are behind on utility bills are no longer protected from shutoffs by a statewide order enacted in April 2020 in response to the COVID-19 pandemic. The study reveals clear patterns of inequity: Neighborhoods with high gas bill debt rates also have higher poverty rates, lower incomes, more renters than homeowners and higher proportions of Black and Latinx residents than the average neighborhood served by Southern California Gas.
The research team analyzed data from the utility, which provides gas service to about 50% of California residents. The team found that, as of February 28, 2021, 1 in 5 customers were at least 30 days behind on their gas bill payments, and almost 1 in 10 were at least 90 days behind.
The report provides several lessons for policymakers to equitably relieve the burden of utility debt on customers. The authors recommend improving the data available on utility debt and shutoffs to lead to better-informed decisions. They also note the importance of targeting relief aid at the most affected, lowest-income households.
The co-authors also emphasize a connection between their findings and the growing movement toward building electrification. Transitioning residential buildings to run on electricity alone is significant to avoid greenhouse gas emissions — especially since natural gas is composed primarily of methane, a major contributor to climate change. But this transition may impose high costs on people who already face utility debt.
“When higher-income households stop using gas, lower-income households may be saddled with higher and higher gas costs,” said Silvia González ’09, MURP ’13, UP PhD ’20, director of research at LPPI. “It is essential to make electrification equitable, which means households don’t get left behind or stuck with increasingly unmanageable energy costs.”
Because lower-income households could be negatively impacted by the fixed costs of gas service — the costs that don’t go down when there are fewer customers — the researchers advise that more research is needed to understand and mitigate this impact.
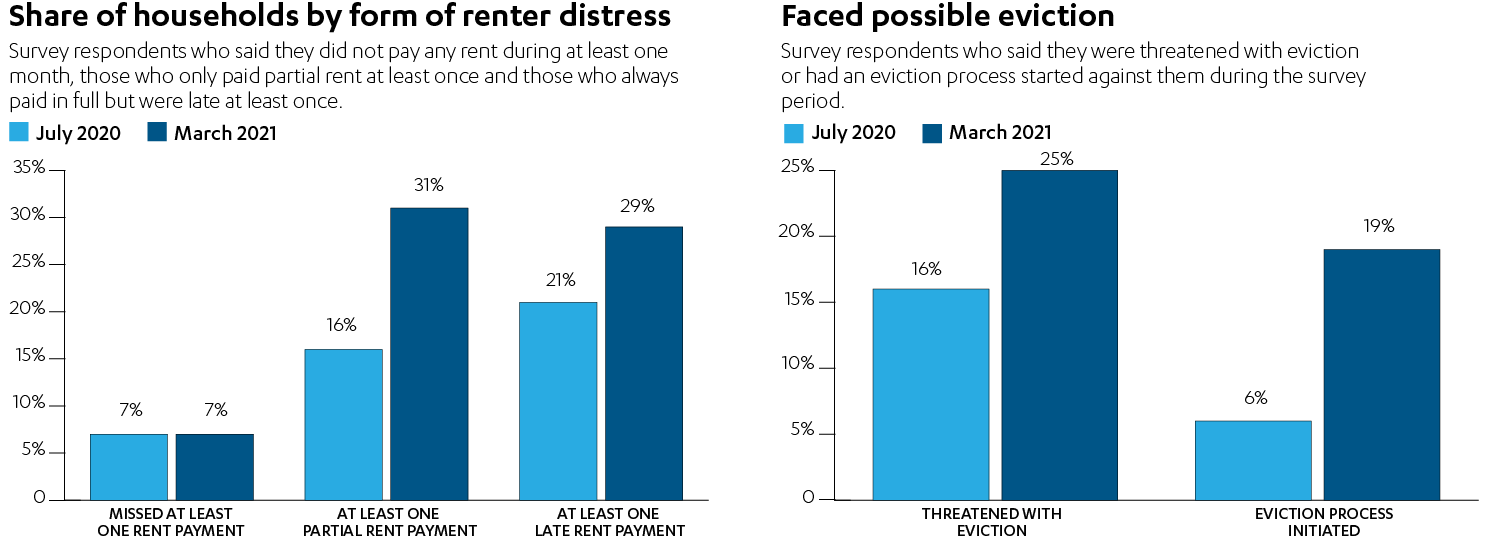
In a new survey of Los Angeles County renters, 49% of households reported that they were unable to pay all of their rent during the pandemic.
The study, by researchers from UCLA and the University of Southern California, found the median amount renters owe their landlords is $2,800. That suggests that countywide, tenants owe landlords upwards of $3 billion.
The findings are from one of a pair of surveys of 1,000 renters each — one conducted in July 2020, which focused on renters’ ability to pay rent in the short term, and another in March 2021, asking about their ability to pay over the entirety of the pandemic.
The preliminary results show that in both surveys, about 7% of renters missed a full rent payment in at least one of the three months before the study was conducted. But by the time the second survey was conducted, the share of renters paying less than the full amount to a landlord at least once during the crisis had almost doubled to 31%, up from 17% in July 2020.
A slight majority of respondents reported paying their rent on time and in full, and many of those who owe rent said they were behind by less than a month. But other renters are emerging from the COVID-19 emergency in a financial hole they will struggle to climb out of on their own, the authors write in a research brief published today.
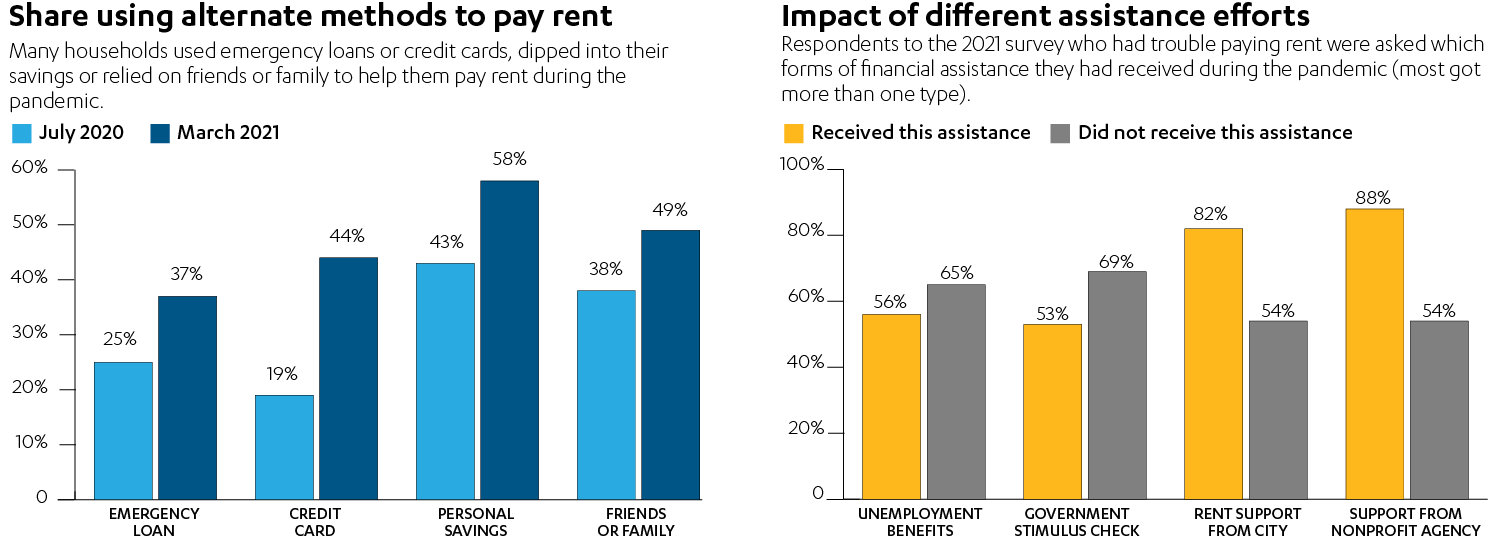
Of particular concern is evidence from the surveys that renters’ debt rose sharply as the COVID-19 crisis dragged on. Only about 6% of Los Angeles tenants reported using a credit card to pay their rent prior to the pandemic. That figure rose to 19% of respondents in the early days of the emergency, and to 44% in the latest survey. Also in the 2021 survey, 49% said they turned to friends and family to help them pay rent, 58% dipped into their savings and another 37% reported taking out an emergency or payday loan.
The overall share of renters taking on debt reached 45% in the second survey, up from 32% in the first.
Other findings include:
Just over 15% of tenants who were behind on their rent payments in 2020 had been threatened with eviction; that figure increased to 25% in the 2021 survey. Although an eviction moratorium is still in effect in Los Angeles County, tenants can still be threatened with evictions or have evictions initiated against them; a court won’t act until the moratorium ends.
Similarly, 6% reported in 2020 that an eviction had been initiated against them. In 2021, that percentage tripled to 18%.
In the 2021 survey, about 68% of all respondents said they had received federal aid during the pandemic, and about 15% reported getting local aid.
California’s eviction moratorium will remain in place through at least September, and the brief notes that the state has committed to helping renters pay the back rent they owe. Through existing rental assistance programs, which generally require that both landlords and tenants agree to participate, the state or city pays landlords on behalf of tenants who qualify for assistance.
The problem? The data show that many tenants owe money to people or institutions other than their landlords, and the researchers write that many may be in that position precisely because they were deeply concerned about their housing security.
The report suggests a solution often advocated by economists as the best way to help people facing financial trouble: Just give people money. Distributing cash to tenants who are financially distressed would allow them to pay back whomever is owed the money — a landlord, another creditor or a family member.
“Programs where the government pays a landlord are sometimes justified as ways to prevent fraud or misuse,” Manville said. “And we should certainly be concerned about fraud. But we need to weigh those concerns against the possibility that an overly cautious program will deny needed assistance to some people who are in real financial trouble.”
To allay concerns about fraudulent claims — which in most government redistribution programs are very rare — the authors suggest ways the state could ask for evidence of debt, lost work or income.
Two centers housed at UCLA Luskin have received research awards from California 100, an ambitious statewide initiative to envision and shape the long-term success of the state.
The Lewis Center for Regional Policy Studies will evaluate current facts, origins and future trends in housing and community development, while the UCLA Institute of Transportation Studies will look into transportation and urban planning. In total, researchers from four UCLA organizations will spearhead three of the 13 California 100 research areas.
The Lewis Center will summarize California’s housing market and outline a vision for how policy changes could lead to a brighter future for the state’s residents, with a particular focus on increased equity and housing production. Working alongside cityLAB UCLA and the Terner Center for Housing Innovation at UC Berkeley, the Lewis Center team will also create a visualization of this future through creative techniques of diagramming, drawing and rendering to help readers picture the possibilities for California’s communities.
UCLA ITS will delve into transportation policy contradictions: California has invested substantially in public transit, while other public policies encourage driving and work against transit. As the state looks to meet its climate and equity goals, transportation systems — and the land use context surrounding them — will play a key role.
Research for both projects is slated to begin over the summer and be complete by December 2021, and will lead to a set of policy alternatives for the future of California. The policy alternatives will be developed in conjunction with research teams from the other California 100 issue areas.
The California 100 Commission is a multi-generational advisory body that will develop recommendations for the state’s future and test those recommendations across a broad set of policy areas by directly engaging Californians.
“From climate change to aging populations and rapid changes in industry, California will face enormous challenges in the years ahead,” said Kathrick Ramakrishnan, California 100 executive director. “We are fortunate to be able to draw on the deep talent of researchers in California to produce evidence and recommendations that will inform robust public engagement and set the state on a strong, long-term trajectory for success.”
About the California 100 Research Grants
California 100 is a new statewide initiative being incubated at the University of California and Stanford University focused on inspiring a vision and strategy for California’s next century that is innovative, sustainable and equitable. The initiative will harness the talent of a diverse array of leaders through research, policy innovation, advanced technology and stakeholder engagement. As part of its research stream of work, California 100 is sponsoring 13 research projects focused on the following issue areas:
Advanced technology and basic research
Arts, culture and entertainment
Education and workforce, from cradle to career and retirement
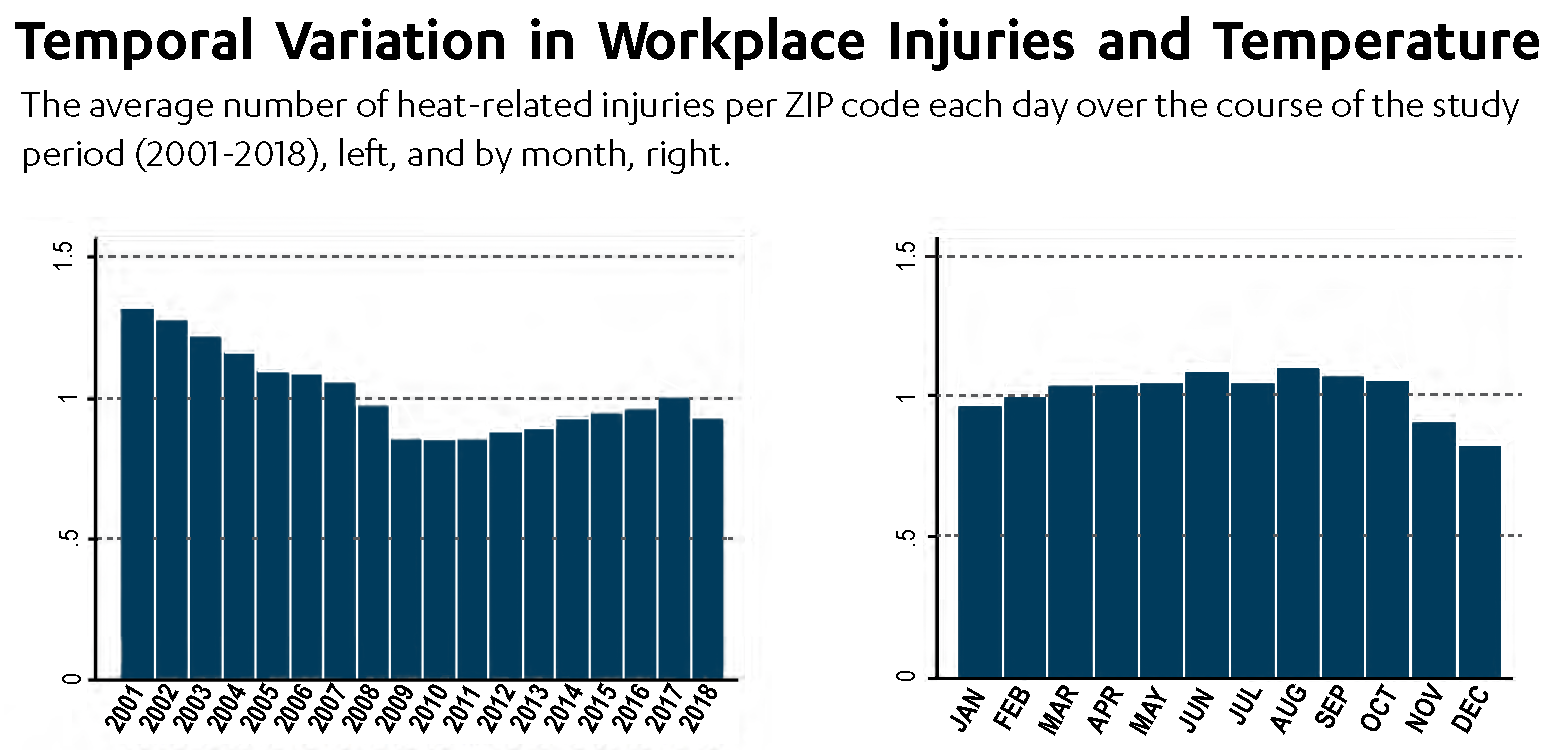
A UCLA study published todayshows that hot weather significantly increases the risk of accidents and injuries on the job, regardless of whether the work takes place in an indoor or outdoor setting.
The report is based on data from California’s workers’ compensation system, the nation’s largest.
“The incidence of heat illnesses like heat exhaustion and heat stroke definitely go up on hotter days,” said the study’s lead researcherR. Jisung Park, an assistant professor of public policy at UCLA Luskin. “But what we found is that ostensibly unrelated incidents — like falling off a ladder or being hit by a moving truck or getting your hand caught in a machine — tend to occur more frequently on hotter days, too.”
By comparing records from more than 11 million California workers’ compensation claims from 2001 to 2018 to high-frequency local weather data, Park and his co-authors isolated the impact of hotter days on the number of injury claims.
The study shows that on days with high temperature above 90 degrees Fahrenheit, workers have a 6% to 9% higher risk of injuries than they do on days with high temperatures in the 50s or 60s. When the thermometer tops 100, the risk of injuries increases by 10% to 15%.
Those findings are particularly alarming in the context of climate change, which is expected to produce more high-temperature days each year. The researchers estimate that high temperatures already cause about 15,000 injuries per year in California.
“Heat is sometimes described as a silent killer,” said Nora Pankratz, a UCLA postdoctoral scholar. “But if you look into the data and do the statistical analysis, you find that heat has a significant impact on mortality and health outcomes.”
It’s not surprising that hot weather would lead to injuries and illness among workers in predominantly outdoor industries such as agriculture, utilities and construction. But the data consistently show that industries in which most people work indoors are affected as well. In manufacturing, for example, days with high temperatures above 95 degrees have an injury risk that is approximately 7% higher than days with high temperatures in the low 60s.
“A lot of manufacturing facilities are not air conditioned,” said Stanford University postdoctoral scholar A. Patrick Behrer, the study’s other co-author. “Because you’re inside, you don’t necessarily think about the temperature as being a major threat.”
The reality is that overheated workers face numerous risks, regardless of where the work occurs.
“Heat affects your physiology,” Park said. “It affects your cognition. It affects your body’s ability to cope. It seems possible that what we’re observing in the data for these workers is that they’re more likely to make mistakes or errors in judgment.”
The researchers found that heat-related workplace injuries are more likely to be suffered by men and lower-income workers. In addition, younger people suffer more heat-related injuries, possibly in part because they’re more likely to hold jobs with greater physical risks on construction sites, in manufacturing plants or at warehouses.
For an office worker at a computer desk, nodding off on a hot summer afternoon is unlikely to cause an injury. “But if you have a huge chainsaw in your hand, you’re not in a great situation,” Park said.
Among the paper’s other conclusions:
The number of heat-related injuries actually declined after 2005, when California became the first state to implement mandatory heat illness prevention measures for outdoor workplaces on days when temperatures exceed 95 degrees.
The financial costs of heat-related injuries may be between $750 million and $1.25 billion per year in California alone, considering health care expenditures, lost wages and productivity, and disability claims.
Inequalities in the labor market are exacerbated in part by the fact that low-income communities tend to be situated in hotter parts of the state. People in the state’s lowest household income tier are approximately five times more likely to be affected by heat-related illness or injury on the job than those in the top income tier, the study found.
The UCLA Luskin Center for Innovation, where Park is associate director of economic research, provided funding for the study. It is available now through the Institute of Labor Economics, which disseminates working versions of potentially influential research prior to publication in academic journals. Park previewed the findings July 15 during testimony at a Congressional hearing organized by the House Select Committee on the Climate Crisis.
The new study echoes the results ofa 2019 study that focused on how extreme temperatures raise injury risk in Texas and in the U.S. mining industry. Park, whoseprior research includes a finding that student learning is negatively impacted by warm temperatures, said there has been “an explosion of research just in the last five to 10 years that illustrates, using data, the serious consequences of climate change for health, productivity and economic growth. This likely adds to that urgency of reducing greenhouse gas emissions now.”
Pankratz got involved in the study while working at UCLA Luskin as a postdoctoral scholar, having previously researched the impact of heat on businesses while working toward her Ph.D. in the Netherlands.
Worldwide, she said, there is growing interest in the concept of adaptation — the pragmatic changes that can be made by governments and businesses to cope with the reality of climate change.
“For a long time, the focus has been on mitigation — what can we do to prevent climate change,” she said. “But as it becomes more and more obvious that there is policy inertia on mitigation, it’s important to think about what we can do to adapt and to work as well as possible in a warmer world.”
The study authors, all of whom have backgrounds in economics, realize that the desire to protect workers from heat may be complicated by economic reality.
Behrer said policymakers could stipulate that workers not be exposed to the heat on days above 100 degrees, for example, without proscribing a specific strategy to be used by individual business owners.
“Then firms have the option either to use air conditioning or come up with some other method of climate control for their facilities,” he said, noting that some might change work hours or shorten the work day during heat waves. “It allows them to decide the most cost-effective way for them to meet the objective of reducing workplace injuries.”
With cities and suburbs across the United States facing well-documented affordable housing shortages, researchers for years have studied how government planning standards affect housing costs.
Those studies often examine how planning and zoning decisions affect traffic noise, whether neighborhood amenities can be reached by foot and other factors that can make a home more or less valuable.
A new paper expands this body of research by considering the housing, schools, parks and other infrastructure that go unbuilt in favor of wide streets.
The U.S. has some of the widest streets in the world. In 20 of the most populous counties, the median residential street plus sidewalks is 50 feet wide, with the dollar value of land used for streets sometimes stretching into six figures, according to the research in the Journal of the American Planning Association.
A narrow street in Shibuya City, Tokyo. Photo by Tim Foster / Unsplash
Wide streets are less common in some other countries. Certain streets in Japan, for example, are much narrower. Developments in Tokyo since 1990 have average street widths of 16 feet, noted Adam Millard-Ball, an associate professor of urban planning at the UCLA Luskin School of Public Affairs and author of the new paper.
“One of the best ways to alleviate the housing crisis is to build more housing,” he said. “To the extent that narrower streets allow developers to build more housing, that will address the No. 1 issue with housing right now.”
The median residential street in Arizona’s Maricopa County, which includes Phoenix, is 50 feet wide, according to Millard-Ball’s sample of counties.
The median width of a residential street in Middlesex County, Massachusetts, which includes Cambridge, is 40 feet — the narrowest of the group.
The widest streets in the sample are in Cook County, Illinois, which includes Chicago. There, the median residential street is nearly 65 feet wide.
The 50-foot standard
For urban planners, a street is called a right of way. The paved section is the roadway.
A right of way includes the roadway as well as sidewalks, if any, along with space for drainage, utility poles and other public infrastructure. It’s the land usually owned by a city or county that the public has the right to use and make its way through by car, bicycle, foot or other mode. Neighbors waving hello across the sidewalk’s edge of their properties are waving across the right of way.
The median 50-foot right of way Millard-Ball documents stems from nearly a century of history in U.S. planning. After the home mortgage system collapsed during the Great Depression, the federal government stepped in and established the Federal Housing Administration in 1934.
The agency’s mortgage insurance and financial assistance for homebuyers represented “the most ambitious suburbanization plan in United States history,” wrote Michael Southworth and Eran Ben-Joseph in a 1995 Journal of the American Planning Association article that reviews the historical rise of U.S. suburbs.
To protect the government’s unprecedented investment in home ownership, mostly for white Americans, developers had to have detailed plans approved by the agency. The agency encouraged cul-de-sacs for new developments and favored plans that discouraged through traffic.
“Moreover, the FHA, unlike other planning agencies, was largely run by representatives of real estate and banking, so developers felt that its intervention protected their interests,” Southworth and Ben-Joseph wrote.
If developers wanted to build homes that would benefit from federal financial backing, rights of way had to be at least 50 feet wide, Millard-Ball explained in his new paper, “The Width and Value of Residential Streets.”
Six-figure values
To understand the value of land used for streets, Millard-Ball drew on research from the Federal Housing Finance Agency that estimates the value of quarter-acre lots zoned for single-family homes across the country. The value of the land used for streets can be substantial in places where low population density and high housing costs converge.
Santa Clara County, California, which includes San Jose, has the most valuable streets in the sample at $146,000 per tax parcel. That’s roughly 40% of the median price of an existing single-family home sold in the U.S. in April 2021, according to data from the National Association of Realtors.
“One of the best ways to alleviate the housing crisis is to build more housing. To the extent that narrower streets allow developers to build more housing, that will address the No. 1 issue with housing right now.”
— Adam Millard-Ball, UCLA Luskin
New York City, by contrast, has high housing costs but also high density — large apartment buildings are common. Tens of thousands of people live within each square mile. The land beneath streets in Queens, for example, is worth $36,000 per parcel.
At the other end of the value spectrum, streets are worth $7,000 per parcel in Bexar County, Texas, which includes San Antonio. But land values and street widths can vary greatly within counties.
Terra Vista, a small street in a subdivision 25 miles north of San Antonio, is 52 feet wide and has a land value of $43,288 per parcel. All the land under residential streets in Millard-Ball’s 20 counties is worth nearly $1 trillion in total.
Millard-Ball noted that street land value estimates per parcel are likely low for high-cost, dense cities, which often zone for multifamily buildings over single-family homes.
For example, an Italian specialty food store in the Mission District of San Francisco sold its parking lot for $3 million in 2018 — roughly $36 million per acre, by Millard-Ball’s calculation — to make way for a five-story, 18-unit building, according to the news site Mission Local.
Most U.S. counties regulate how and where new housing and business developments are built, according to the National Association of Counties, a nonprofit organization that represents U.S. county governments.
Many large cities do the same.
It would be overly costly for cities and counties to change the width of existing streets, particularly with local governments facing budget shortfalls during the pandemic.
Still, the estimates in the new paper can be instructive for planning officials in places like Bexar, one of the fastest growing counties in the U.S., as they permit developments to accommodate new and current residents.
“The values are an indication that cities should be making it easier to use streets for something other than roadways and parking,” Millard-Ball said. “A good analogy is that during COVID, one use of streets has been for outdoor dining. It’s recognition that this land is more valuable to the community if we can use it for people to get together and eat in a safer environment outdoors, than as a parking space or travel lane for cars.”
He continued: “The point is that desolate asphalt is doing nobody any good — not the city, not property owners, not anyone. Cities are often keen to widen the right of way with new developments. Say you want to develop a new apartment building. Often, the city will say, ‘Sure, but you have to give up some land so we can add a turn lane, or widen the sidewalk.’ If cities can widen the right of way, why can’t they narrow it in exchange for improvements that will benefit the public?”
Indeed, when a new residential building goes up, cities commonly require developers to widen streets, according to a 2017 paper in the Journal of Transport and Land Use by Michael Manville, another UCLA Luskin urban planner.
In the paper, Manville looked at how the requirement played out in Los Angeles from 2002 to 2012. He found the city’s predictions of increased traffic with the arrival of new buildings were often wrong, and “the standards the law is based on are in some ways unverifiable. Thus the law likely does little to reduce congestion and probably impedes housing development.”
Flexible design
City and county planning standards vary and change, but the federal 50-foot standard still often dominates residential street design. Still, it’s not always true that counties with more land to expand, like those in Texas, have wider streets. Dallas County, for example, specifies that new residential streets in subdivisions be at least 50 feet wide. The median width of residential streets there is exactly 50 feet, Millard-Ball finds.
A surveyor’s chain owned by John Johnson, appointed Surveyor General of Vermont in 1813. Photo by John Johnson Allen / National Museum of American History
Residential streets in Chicago, meanwhile, are typically 66 feet wide, according to city design standards. That roughly matches the length of the typical surveyor’s chain as the city grew throughout the 1800s and early 1900s. The surveyor’s chain was a tool made up of interlocking metal bars that land surveyors used to measure and mark the shapes of streets to be built.
Uniformity in street design made sense as the nation was expanding and infrastructure technologies were less advanced. But the takeaway for Millard-Ball is that maintaining rigidity in street design means fewer amenities and, potentially, less housing.
He wonders, for example, whether more streets could be built with parking cutouts only where there are no private driveways — providing a unique residential landscape alongside opportunities to use more of the built environment for activities other than driving.
“That would make construction drawings more complex,” Millard-Ball said. “The tradeoff is visual interest — and saving a lot of valuable land.”
The prospect of narrower streets raises the question of whether emergency vehicles would be able to pass, though some planners, and at least one report from the U.S. Department of Transportation, suggest smaller emergency vehicles could be an answer.
This article first appeared on The Journalist’s Resource and is republished here with slight revisions for local style under a Creative Commons license.
Residents of Los Angeles County have been deeply affected by the COVID-19 crisis, with significant numbers citing the pandemic’s adverse impact on their finances, health and children’s education, according to UCLA’s sixth annual Quality of Life Index.
“A year ago we speculated about how resilient our region would be in the year to follow,” said Zev Yaroslavsky, director of the Los Angeles Initiative at the UCLA Luskin School of Public Affairs, who oversees the index. “We now know that Los Angeles County has demonstrated robust resilience, but a significant toll has been exacted on our residents by the tumultuous events. Many of our residents — especially younger ones — are anxious, angry and steadily losing hope about their future in Los Angeles.”
This year’s Quality of Life Index, or QLI, was based on interviews with 1,434 county residents over a 20-day period beginning on March 3, just as vaccinations were beginning to fuel optimism about a possible return to more normal life. Last year’s survey, conducted in the earliest stages of the pandemic, found high levels of anxiety about the possible impacts of COVID-19. Twelve months later, respondents said many of those fears had come to pass:
More than half of those surveyed (54%) reported that they or a close family member or friend had tested positive for the coronavirus.
Forty percent said their income went down because of the pandemic, with 22% saying it dropped “a lot” and 18% reporting “some” decline. Roughly 1 in 5 (18%) said they had lost their job at some point during the COVID-19 crisis.
Three-quarters of parents (76%) with school-age children felt their kids had been “substantially hurt, either academically or socially,” by pandemic-related distance learning and quarantine experiences.
In addition, nearly a fifth (17%) of all respondents reported that their income declined “a lot” in the past year and that they also suffered at least two specific negative impacts, such as a job loss, a wage or salary reduction, a decline in work hours or difficulty paying their rent or mortgage. This group was disproportionately composed of women under age 50, single people, renters, those without college degrees and those with household incomes of less than $60,000.
“These are among the most vulnerable individuals living in our county,” Yaroslavsky said.
The QLI, a joint project of the UCLA Luskin Los Angeles Initiative and The California Endowment with major funding provided by Meyer and Renee Luskin, asks a cross-section of Los Angeles County residents each year to rate their quality of life in nine categories and 40 subcategories. Full results of this year’s survey were made available April 19 as part of UCLA’s Luskin Summit, which is taking place virtually.
Mirroring last year’s result, this year’s overall quality-of-life rating held steady at 58 (on a scale of 10 to 100), which is slightly more positive than negative. But researchers noted that marked changes emerged among specific racial and ethnic groups, especially with younger residents.
Younger Angelenos: Sinking optimism, tempered by race
Reflecting a trend seen in recent QLI surveys, the county’s younger population — those between the ages of 18 and 49 — rated their quality of life lower than older residents, and the pandemic seems to have exacerbated that disparity.
“The varied manifestations of COVID-19,” Yaroslavsky said, “fell most heavily on the shoulders of younger county residents.”
In particular, researchers observed a growing belief by younger Angelenos that the cost of living in the region is threatening their ability to make ends meet, get ahead or gain some sort of financial security.Yet even among this demographic, the survey revealed a distinct divergence in views between Latinos and whites, the two largest racial/ethnic groups in the county. While they have faced demonstrably harder challenges in the region, Latino residents overall were more positive about their quality of life than whites — and this was particularly pronounced among younger residents.
“Repeatedly, younger Latinos are more positive about their own conditions and express greater approval and positivity toward the variety of public officials and governmental entities that affect their lives,” said Paul Maslin, a public opinion and polling expert with Fairbank, Maslin, Maullin, Metz & Associates (FM3 Research) who has overseen the QLI survey process since 2016. “Among younger white residents in Los Angeles County, a greater sense of frustration and even bitterness is apparent.”
The survey uncovered a number of noteworthy differences in these two groups’ views of the pandemic, public officials and the opportunities available in the region:
Younger white residents were evenly split over whether the handling of the pandemic had been fair or unfair to “people like them” (48% vs. 49%), whereas younger Latinos reported that it had been fair to them by a 2-to-1 margin (65% vs. 33%).
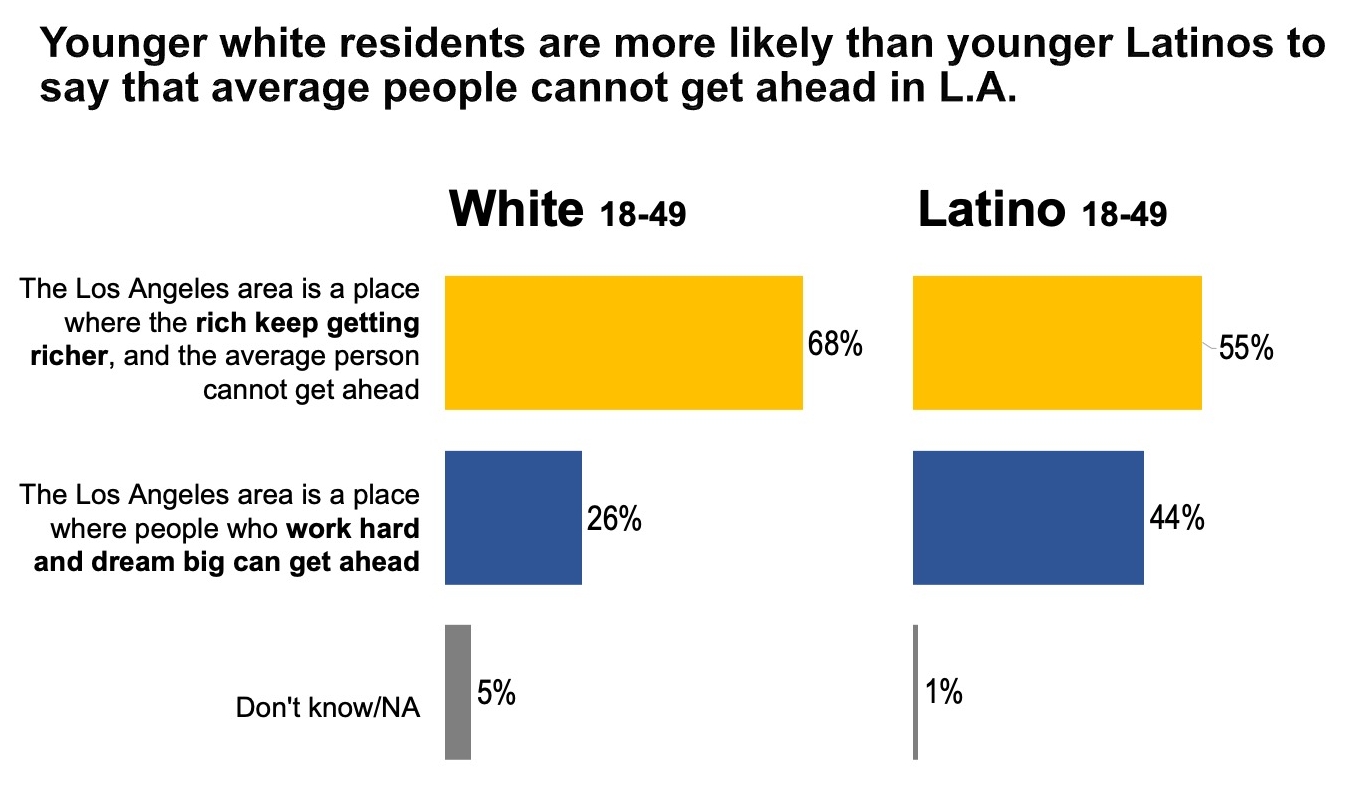
About two-thirds (68%) of younger whites believe the Los Angeles area is a place where the rich get richer and the average person can’t get ahead, compared with only 55% of younger Latinos.
Younger Latinos had more favorable views of Los Angeles Mayor Eric Garcetti (57%) and Gov. Gavin Newsom (53%) than younger whites, 57% of whom had unfavorable views of Garcetti and 62% unfavorable views of Newsom.
Younger white residents rated the response to the pandemic — across all levels of government — much more harshly than younger Latinos. Only about a third of whites approved of the response of federal, state and county governments and local school districts. Latinos’ ratings of approval were at least 20 points higher for every level of government and for local school districts.
However, in terms of paying their rent, more younger Latinos (43%) reported falling behind than did young whites (31%).
The 2021 QLI: Resilience and change
While this year’s quality-of-life rating remained at 58 overall, reflecting a remarkable resilience among county residents, several significant shifts within the nine major categories that make up the survey tell a different story.
This was most noticeable in the education category, where the satisfaction rating of respondents with children in public schools dropped from 58 last year to 52 this year, one of the most dramatic one-year declines in any category in the QLI’s history.
Satisfaction ratings for public safety also fell over the past year, from 64 to 60, influenced significantly by a growing concern over violent crime. And respondents’ rating of the quality of their neighborhoods dropped from 71 to 68.
On the other hand, satisfaction with transportation and traffic rose from 53 to 56, which researchers attribute to a significant reduction in commuter traffic caused by pandemic-related workplace shutdowns.
With regard to the workplace, 57% of employed respondents said they currently work from home or split time between home and their place of work. As to the future, 77% said they would prefer a mix of working from home and their workplace when the pandemic ends, with just 16% wanting to “almost always work at home.”
The 2021 UCLA Luskin Quality of Life Index is based on interviews with a random sample of residents conducted in both English and Spanish, with a margin of error of plus or minus 2.6%. The QLI was prepared in partnership with the public opinion research firm Fairbank, Maslin, Maullin, Metz & Associates (FM3 Research). The full reports for 2021 and previous years are posted online by the UCLA Lewis Center for Regional Policy Studies.
California was the first U.S. state to legally recognize access to safe, clean and affordable water as a human right. But substantial parts of the state lack access to drinking water that meets those criteria.
A new study (PDF) published by the California State Water Board and supported by UCLA research identifies a risk for failure among a significant portion of the state’s small and medium-sized public water systems. The report is the first comprehensive analysis of how clean water is provided in California, and it estimates how much it would actually cost to deliver safe water to every resident.
The research was a collaboration between the UCLA Luskin Center for Innovation, the water board’s Needs Analysis Unit, Corona Environmental Consulting, Sacramento State University’s Office of Water Programs, the Pacific Institute and the University of North Carolina’s Environmental Finance Center.
Of the 2,779 public water systems evaluated in the study, nearly half are at some risk of failing to provide an adequate supply of safe drinking water. To measure the health of water systems, the researchers assessed each water system using 19 indicators for water quality, accessibility, affordability and operational capacity.
Based on those assessments, each system received an overall rating indicating how likely it would be to fail — from “not at risk” at the top end of the scale, to “potentially at risk” and “at risk” for the systems with the lowest scores. The researchers found 25% of water systems to be “at risk,” while an additional 23% are “potentially at risk.”
The study also identified locations where groundwater quality is out of compliance with the state’s safe water drinking standards. About one-third of domestic wells and one-half of state small water systems were found to be at a high risk for containing contaminants like nitrate and arsenic.
“Illuminating the extent of at-risk water systems is an important step,” said Gregory Pierce, the study’s principal investigator and an associate director at the Luskin Center for Innovation. “By more fully understanding the issues, we can move to more resilient and accessible water sources.”
The study noted that water quality and infrastructure issues vary substantially across the state. For instance, Kings County, in central California, has the highest proportion of at-risk public water systems (75%), while San Francisco County and Modoc County in the northern part of the state have zero at-risk systems.
The research incorporated a comprehensive evaluation of thousands of water systems and hundreds of thousands of wells, as well as input from water managers, environmental nonprofits and advocacy groups.
Among the other findings:
Holistic solutions can help.
In the short term, bottled water and home filtration systems can be used to help communities that need clean drinking water immediately. The researchers estimate that those short-term interventions would cost between $500 million and $1.6 billion over the next five to nine years.
Long-term solutions include enhancing water treatment; consolidating small, underperforming water systems; and providing experts to advise communities on how to improve those systems. The study estimates a wide range of total costs for those solutions, depending on which actions local systems adopt, but the midpoint estimate is about $5.7 billion.
More funding will be needed.
The Safe and Affordable Drinking Water Fund, which was established in 2019 to help bring adequate drinking water to disadvantaged communities, already provides critical financial support. But for all California communities to have reliably safe drinking water, more financial resources are likely needed.
Additional funding could come from a variety of sources, including the state legislature, the governor’s office and federal agencies.
The analysis suggests prioritizing funding for water systems that are currently most at risk and that are located in underserved communities. It also sets the stage for a deeper investigation of how the state can ensure safe, clean and affordable water for all — an especially salient issue as Congress is considering a federal infrastructure bill that would, in part, address the systems that deliver drinking water throughout the U.S.
“I’m optimistic that as a nation, we’re talking about upgrading our pipes and cleaning up our contaminated drinking water,” said Peter Roquemore, a co-author of the study and a researcher at the Luskin Center for Innovation. “Infrastructure might not always be glamorous, but the impacts of fixing our water systems would be huge.”
New research by the UCLA Luskin Center for Innovation has identified how effective certain incentives can be in motivating people to use less energy in their homes.
Electricity providers often need to encourage customers to reduce consumption in order to prevent blackouts or to avoid having to activate additional power plants — often natural gas-powered plants that pollute the environment.
The researchers found that promotional messages about how customers could save money on their electricity bills or earn other financial rewards were effective at motivating them to use less energy.
For the study (PDF), which was funded by a grant from the California Energy Commission, the UCLA researchers assessed data from energy bills for more than 20,000 California households in territories served by Pacific Gas and Electric, Southern California Edison and San Diego Gas & Electric.
The customers all participate in “demand response programs,” which encourage users to save energy at times of high stress on the electrical grid, like during heat waves; they all also used one of two smartphone apps — Chai Energy or OhmConnect — that help users manage their home energy consumption. Often, the apps offered cash incentives to participants for adjusting their thermostats during times when demand for energy was highest.
The study revealed that offering participants financial rewards, on top of the amount of money they’d save simply for using less energy, had a measurable effect on reducing their energy use — although the amount of the financial incentive made relatively little difference. Collectively, the 20,000 households in the study had received over $1 million in rewards over the previous two years through those incentive programs, in addition to the savings on their electricity bills from using the apps.
Encouraging flexibility in our energy system is especially important as the nation’s infrastructure continues to shift to clean energy. For instance, weather can be unpredictable and impact the amount of electricity generated by solar panels or wind turbines. Demand response programs can be effective at reducing energy use during these times to avoid blackouts.
“In more good news for the environment, our study found that demand response programs result in overall reduction in energy use — not merely a shift of consumption to other hours or days,” said JR DeShazo, the study’s principal investigator and the director of the Luskin Center for Innovation.
That finding is particularly significant because some observers had suspected that demand response programs merely encouraged energy customers to shift their electricity use to other times of day — for example, by waiting to run their dishwashers or clothes dryers during overnight hours, when overall energy demand was lower — but without actually reducing the amount of energy they consumed. But the UCLA report concluded that customers’ energy consumption did not increase in the hours or days surrounding a demand response event, suggesting that the approach resulted in actual reductions in consumption.
The households with the greatest reduction in consumption during demand response events were those with solar panels, plug-in electric vehicles and automation devices — gadgets like smart thermostats that can automatically alter energy usage but can be overridden by the owner. For example, automation devices can delay charging an electric vehicle or turn down an air conditioner until an off-peak time.
“Automation devices make participating in demand response programs effortless, and ultimately rewarding,” said Kelly Trumbull, a co-author of the study and a Luskin Center for Innovation researcher. “They also help secure predictable and reliable energy savings.”
Demand response providers typically reward users based on their energy conservation relative to an energy consumption goal assigned by the utility. Researchers found that households reduce their energy use more when that consumption goal is more ambitious, assuming all other factors are constant.
“This finding underscores the importance of setting baselines and communicating them to customers,” DeShazo said. “If we are asked to do more, we often will.”
The study recommends actions utilities and third-party demand response providers — like the ones that market the energy management apps — can take to maximize both the environmental and economic benefits of residential demand response programs, including:
Offering financial incentives and emphasizing the economic benefits to participants.
Supporting the adoption of automation devices like smart thermostats.
Inducing greater energy savings by setting ambitious conservation targets for customers.
Most Californians, depending on their electricity providers, are eligible to participate in existing demand response services.