By Les Dunseith
A roundtable discussion about the upcoming election of a new mayor in Los Angeles and four other sessions focusing on timely policy issues made up the agenda when the UCLA Luskin School of Public Affairs launched its fourth annual Luskin Summit.
Of the 10 currently declared mayoral candidates, U.S. Rep. Karen Bass has the advantage of name recognition and national political experience, panelists agreed. But City Councilman Kevin de León was also cited as a favorite of many voters based on his prior experience in Sacramento and name recognition from an unsuccessful 2018 bid for U.S. Senate.
The panelists included Steve Soboroff and Wendy Greuel, former mayoral candidates themselves.
Soboroff, who ran for mayor in 2001 in a race won by James K. Hahn, said, “At this point, I think it’s Karen, plus one. And everybody else is trying to be that one.”
He cited Bass’ experience as an elected official at both the state and national levels. “A lot has to do with bringing resources from D.C. and from Sacramento to Los Angeles. And she has the best chance of bringing resources that the others can’t.”
Greuel, who ran for mayor in 2013 in a race won by Eric Garcetti, sees this year’s mayoral election as very close, with even greater uncertainty because of COVID-19 and its ever-evolving impact on society and public opinion.
“Normally, if you were ahead [in polls] five months out, you’re good, you know, and it’s not going to change,” Greuel said about speculating on a political candidate’s prospects for victory. “Now, it changes on a weekly basis.”
Like the mayor’s race, the Luskin Summit was impacted by COVID-19, with the launch event taking place on a remote platform after having been originally planned as an in-person conference. This year’s theme is “Research in Action,” and the sessions include recent research from the Luskin School that relates to current policy issues. The Summit series will continue through April.
The other sessions on Jan. 19 were moderated by faculty members at UCLA Luskin whose areas of expertise include housing policy, climate change, transportation, and class and racial inequality. Recordings of all five sessions are available online.
Author and UCLA Luskin faculty member Jim Newton, the editor of UCLA Blueprint magazine, led the questioning during the mayoral panel. The panelists were Soboroff, Greuel, longtime officeholder and current UCLA faculty member Zev Yaroslavsky and Antonia Hernandez, the president and CEO of the California Community Foundation.
They agreed that homelessness is likely to remain a dominant issue as the mayoral candidates vie for voter attention and approval prior to the June 7 primary and a likely Nov. 8 runoff election.
“I think in every public opinion survey that’s been done in town for candidates … homelessness is No. 1 and nothing else comes close,” Yaroslavsky said. “But it’s more than just homelessness. From my point of view, many people just feel that the wheels are coming off the city and it’s just not working.”
Hernandez said voters are eager for leadership and trustworthiness.
“They want to have a sense of the person — not the political person but the real person. You’re electing a whole package, a whole human being,” she said. “I think the public is really tired of platitudes, you know: ‘I’m going to solve homelessness in the first year.’ Well, it took us 40 years to get to where we are.”
Yaroslavsky said candidates also must navigate sometimes unrealistic voter expectations.
“It’s better to underpromise and overdeliver,” he said. “You’ve got to be honest with the people. One of the lessons I learned in 40 years in politics is that the electorate has a very sensitive BS-sniffing meter. They know when they’re being conned.”
Hernandez expressed similar thoughts: “If it’s not honest, it’s not realistic, then the platitudes aren’t going to get you any votes,” she said.
Homelessness was also the focus of the Luskin Summit session led by Ananya Roy, a professor of urban planning, social welfare and geography who is director of the UCLA Luskin Institute on Inequality and Democracy.
In opening remarks, Miguel Santana of the Weingart Foundation set the stage for a discussion about expanding housing security for L.A.’s unhoused population without losing sight of each individual’s right to self-determination.
“The thing that’s been missing at the heart of homeless service solutions are the actual voices of the people who have been impacted,” said UCLA alumna Ashley Bennett, a founding member of the community organization Ground Game LA.
Joining Roy and Bennett was Gary Blasi, a UCLA professor emeritus of law whose scholarship has shed light on the plight of renters in California.
“Homelessness begins with eviction,” he said. “These are not two separate things, they’re tightly linked.”
A third session taking place during the Summit launch event focused on another issue of huge current public concern: climate change. The session zeroed in on the dangers of rising heat.
Climate change has increased the frequency and lethality of wildfires, floods and hurricanes, said moderator Kirsten Schwarz, associate professor of urban planning. “This session will explore design and policy interventions that can create more livable and resilient cities, specifically focusing on interventions aimed at protecting the most vulnerable populations,” she said.
Among the panelists was Kelly Turner, assistant professor of urban planning and the interim co-director of the Luskin Center for Innovation at UCLA. She spoke about possible mitigation strategies and the importance of partnering with communities that are most vulnerable to extreme heat.
“The burden of heat is incredibly inequitable,” Turner said. “We learn more from talking to the community members about all the pernicious ways heat can impact people and their daily lives. Involving these community groups is going to be essential to any solution.”
Other panelists were Veronica Padilla-Campos MURP ’06, executive director of the nonprofit Pacoima Beautiful; Kristen Torres Pawling MURP ’12, sustainability program director at the Los Angeles County Chief Sustainability Office, and Helen Dowling, data manager for the Public Health Alliance of Southern California.
The Luskin School of Public Affairs is well-known for its research on transportation issues, and Adam Millard-Ball, associate professor of urban planning, moderated a session that included new research on the widespread impact of Uber, Lyft and other ride-hailing companies on a community’s economic, environmental and equity goals.
“How can ride-hailing best serve the public interest?” he asked. “Certainly, on the positive side, ride-hailing is an important mobility option, particularly for people who don’t have a car or perhaps people who can’t drive. But at the same time Uber and Lyft mean more traffic and more local air pollution.”
About a fifth of drivers simply drive around, burning more gasoline and creating more congestion and pollution, according to Millard-Ball and fellow presenter Joe Castiglione, deputy director for technology, data and analysis at the San Francisco County Transportation Authority.
Also participating in this panel was Saba Waheed, research director at the UCLA Labor Center, who noted that gig workers have few employment protections.
The fifth panel discussion of the Summit launch event focused on the impacts of the COVID-19 pandemic on systemic class and racial inequality.
Paul Ong, research professor and director of the Center for Neighborhood Knowledge at UCLA Luskin, was joined by Silvia González, a former colleague at CNK who now works with the UCLA Latino Policy and Politics Initiative; Karen Umemoto, a professor of urban planning and director of the UCLA Asian American Studies Center; and Vickie Mays, a professor of psychology and health services at UCLA.
“Clearly we all understand the last two years has transformed the way we live, work and socialize,” Ong said. “The pandemic has been a once-in-a-century public health crisis, but beyond that, it’s also a pandemic that has generated dramatic economic disruption.”
He noted that racial disruption has been another byproduct, including a rise in hate crimes directed at Asians and health disparities experienced by other races.
The panelists also discussed the so-called digital divide and how unequal access to high-speed internet connections have impacted education, social and racial relationships during the pandemic.
“I think one of the things that we don’t really know exactly the impact of yet is the impact on children for those who don’t have internet access,” Umemoto said.
Leading the city toward solutions to such issues is an expectation of the Los Angeles mayor. Among voters’ biggest concerns is rising crime and how the LAPD should approach it. Los Angeles is among the cities increasingly turning to community policing tactics.
“It’s preventative policing. It’s getting involved with the communities. It’s having a hundred different programs to keep kids from submitting to gangs and submitting to the influences that make them break laws,” said Soboroff, a longtime member of L.A.’s Board of Police Commissioners. “A candidate needs to understand that.”
Yaroslavsky, whose legacy as an officeholder includes police reform, is interested in seeing how the mayoral candidates talk about crime.
“How will the candidates frame it? Are you going to land on one end or the other?” he asked. “I’ve always maintained that good community and police relations, and public safety, are not mutually exclusive.”
The choice of mayor is important, the panelists said, even though the mayor of Los Angeles has limited authority to enact unilateral change.
“In Los Angeles, we have 21 people — 15 council members, one mayor and five supervisors — that control everything,” Soboroff said. “The issue is not about taking power; it’s about giving up power … so something can get done.”
Hernandez said candidates like Bass, de León, City Attorney Mike Feuer and City Councilman Joe Buscaino all have solid records as public servants.
“They are good, decent people. They have served in different positions in government, and … you know that they care deeply about the place,” she said. “So, the real issue is how are they going to bring us together and make us believe that government can work for the people.”
Greuel, whose deep public service experience includes being the current chair of the Board of Advisors at UCLA Luskin, said winning the San Fernando Valley remains pivotal to the mayor’s race. Yaroslavsky agreed, but noted that changing demographics in the Valley, and throughout Los Angeles, mean that strategies that won past elections may not hold true anymore.
“It’s a much more complicated electorate now,” he said.
The Luskin Summit is scheduled to resume Feb. 15 with a session focusing on voter suppression attempts. Sessions to follow will look at policy issues from a global perspective. Details about the Luskin Summit series can be found online, and interested parties may register at this link.
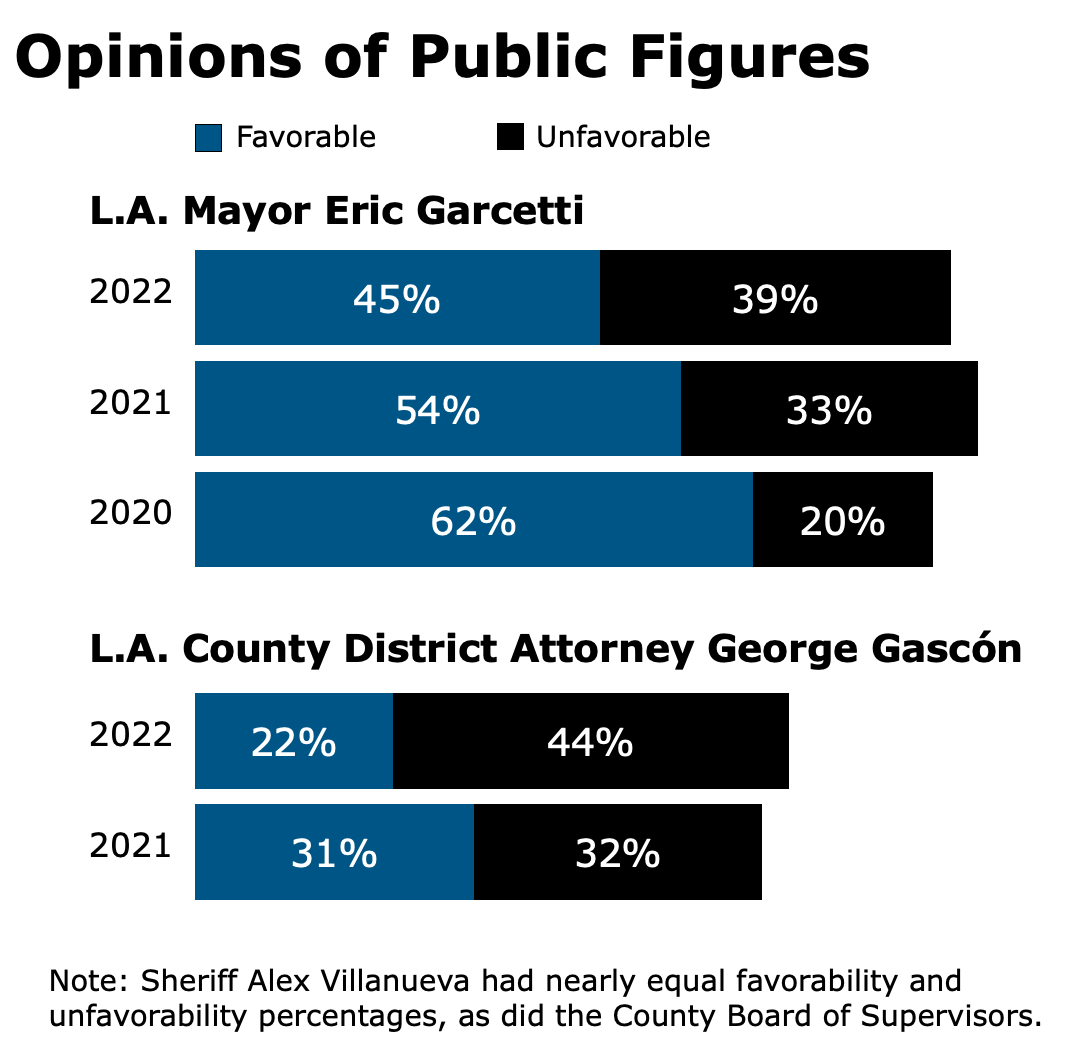
Luskin Summit 2022 will close April 22 with a two-session event focusing on the Quality of Life Index, a project under the direction of Yaroslavsky in his role with the Los Angeles Initiative at UCLA, and a roundtable discussion about the importance of governors in California moderated by Newton. It will be presented both virtually and in-person on the UCLA campus if COVID-19 protocols allow.
This year’s Luskin Summit sponsors are the Weingart Foundation, the Wasserman Foundation, the David Bohnett Foundation, the California Wellness Foundation and the Los Angeles Rams. The media partner is ABC7 in Los Angeles.
Stan Paul and Mary Braswell also contributed to this story.
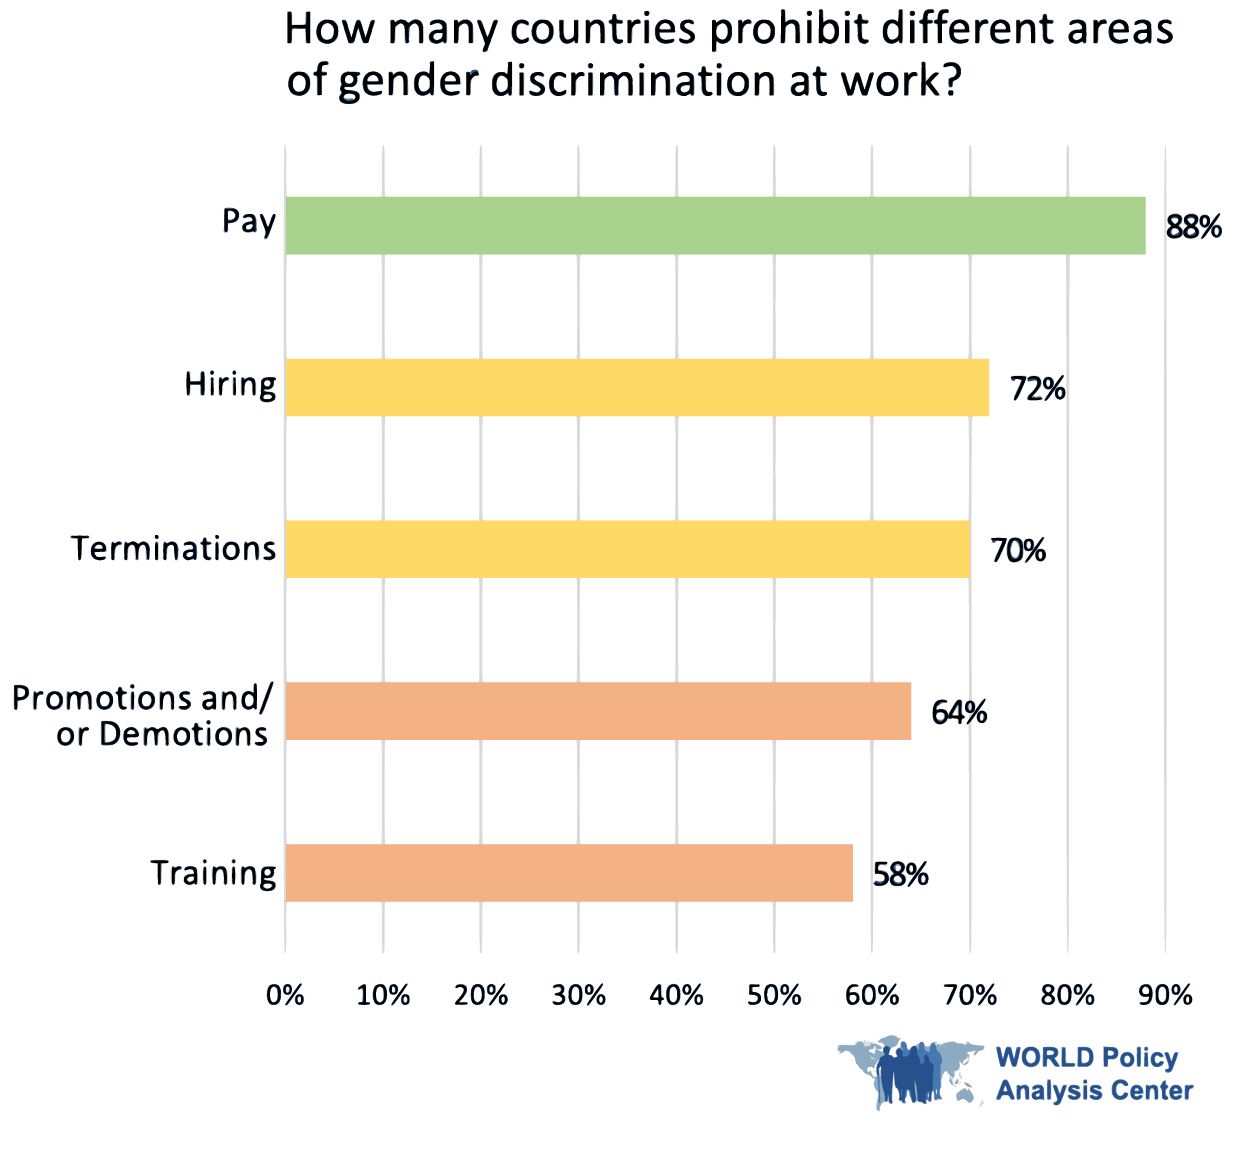 Heymann and her research team analyzed national laws and policies in all 193 countries of the United Nations. Among their findings:
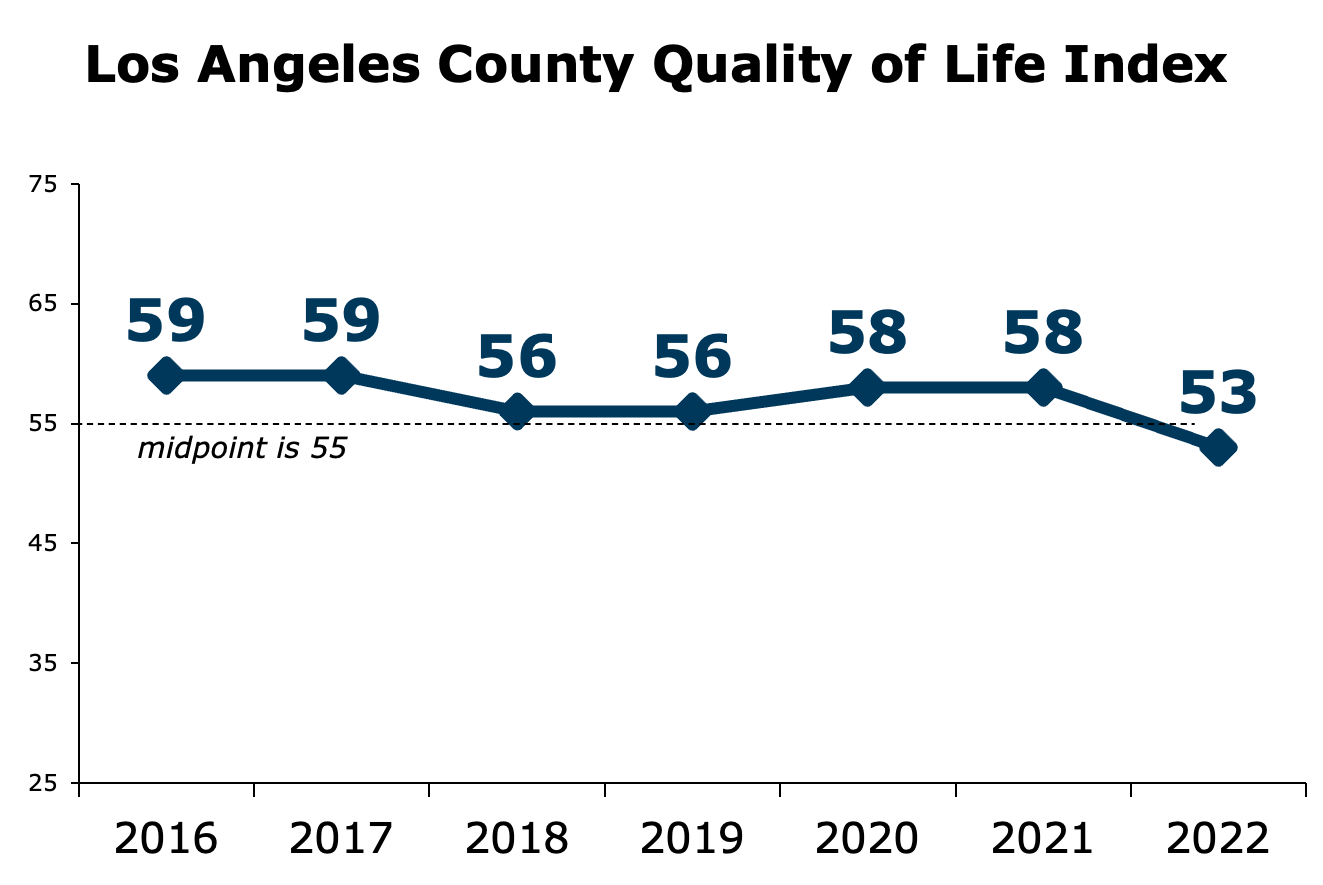
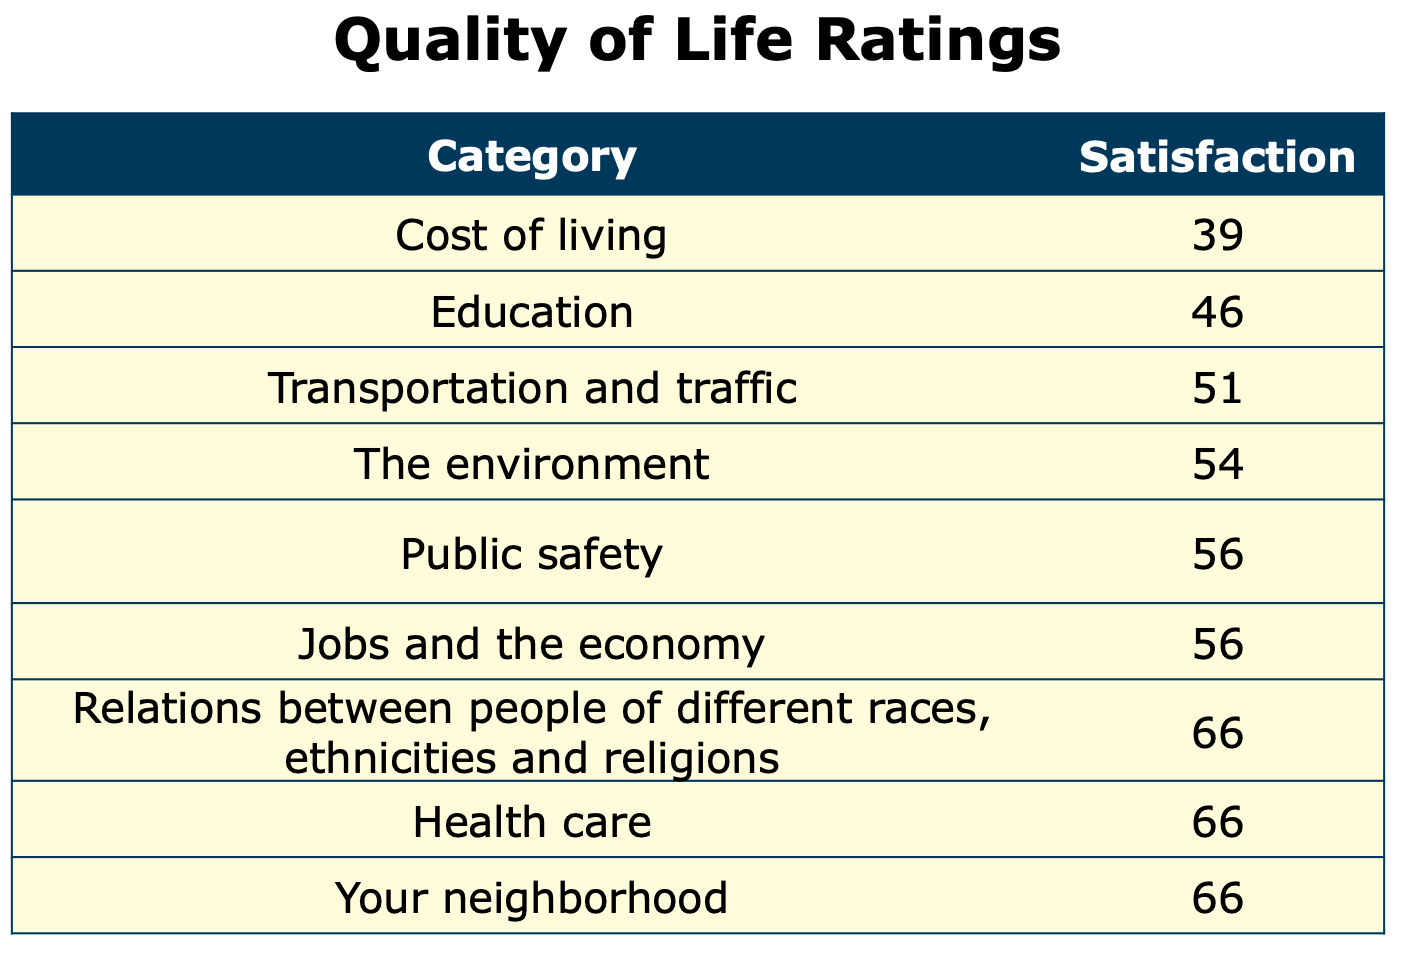 Scores declined in all nine of the survey categories, but the issues that were most responsible for the overall decline were cost of living, education and public safety.


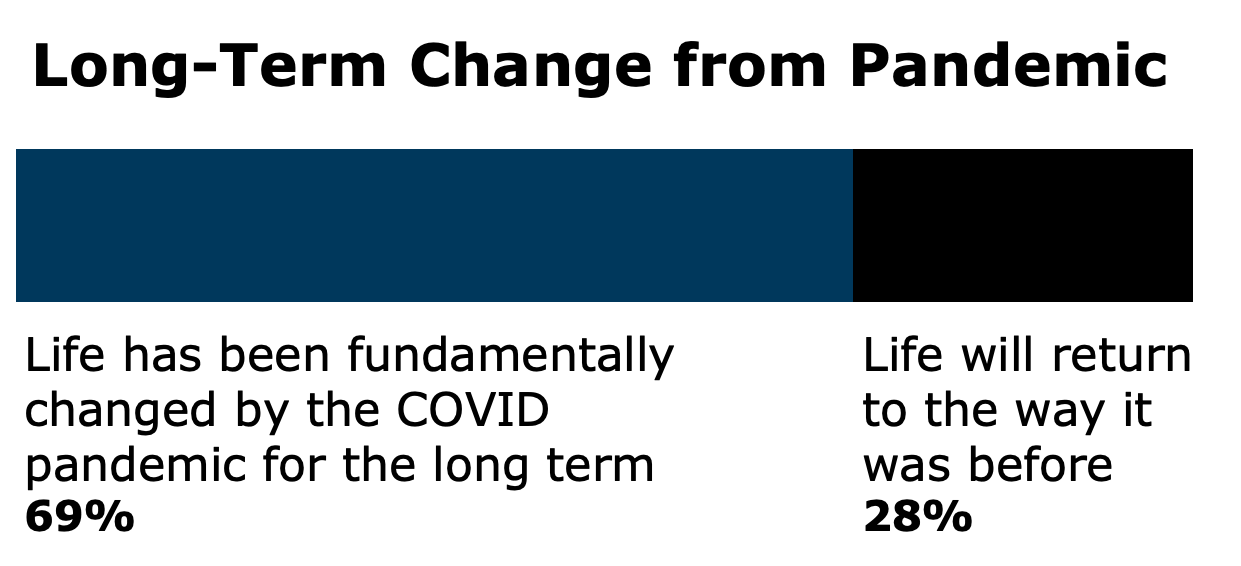 Most respondents, 69%, said life has been fundamentally changed by the COVID-19 pandemic. Only 28% said that life would return to the way it was before.